

In an article review recently published in the open-access journal Sustainability, researchers discussed the development of a near-infrared (NIR) spectroscopy-based methodological approach for the recognition of end-of-life textiles in a circular economy perspective.

Study: End-of-Life Textile Recognition in a Circular Economy Perspective: A Methodological Approach Based on Near Infrared Spectroscopy. Image Credit: NicoleTaklaPhotography/Shutterstock.com
Background
The least harmful methods of disposing of textile waste to the environment are reuse and recycling. Only 1{05995459f63506108ab777298873a64e11d6b9d8e449f5580a59254103ec4a63} of all textiles are currently recycled into new textiles worldwide. Since practically all textiles are totally recyclable, landfilling ought to be the very last method of waste management. The previously indicated detrimental environmental effects connected to this industrial sector might be decreased by increasing the recycling rates for textiles.
Technologies for recycling textiles are developing quickly with the goal of producing more secondary raw materials of higher quality. The identification of fiber typologies that make up the trash is one of the most crucial difficulties in textile recycling. In order to create a proper recycling system, textile fiber identification and sorting by material or blend are crucial.
Based on its makeup, textile waste requires various recycling processes. An effective recycling process is only feasible if low-cost, automatic systems are used for the identification and classification of end-of-life textiles. The development of an autonomous sorting system could significantly cut down on process expenses and duration.
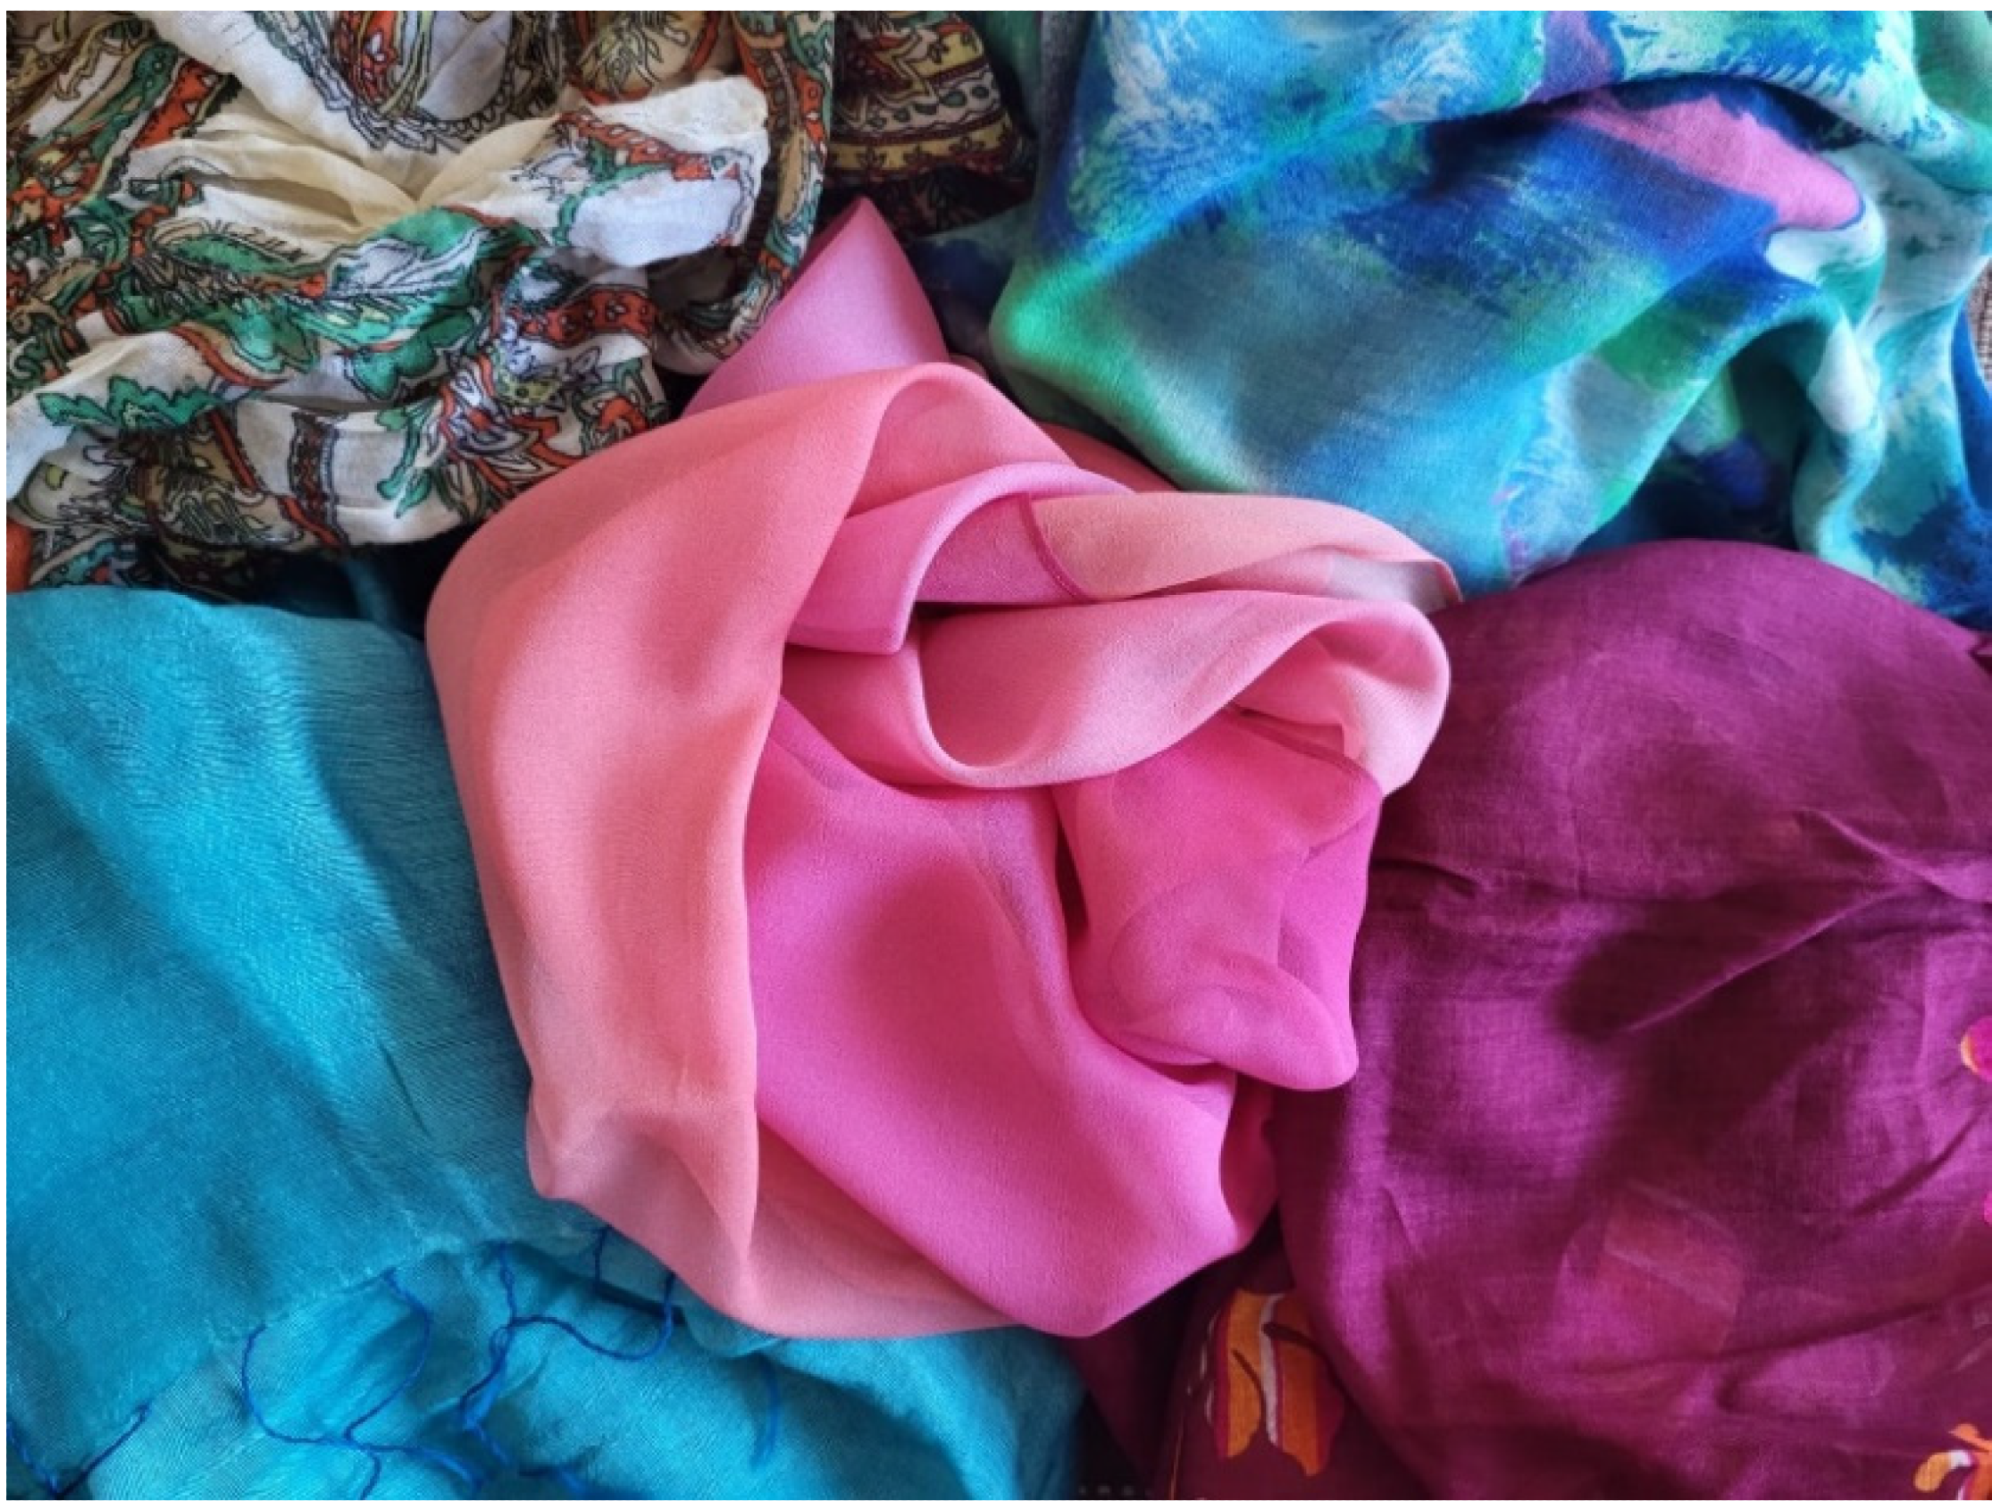
Selected end-of-life textile apparel. Image Credit: Bonifazi, G et al., Sustainability
About the Study
In this study, the authors used NIR spectroscopy (1000–1650 nm) was used using a hyperspectral imaging (HSI) platform and a portable spectroradiometer to extract data on the fabric composition of cotton, viscose, silk, and some of their mixtures. Both detection devices properly identified the various fabrics based on their spectral characteristics.
The team used the proposed methodological approach for quality control in the industrial and/or laboratory scale textile recycling industry owing to its simplicity of use and speed of detection. The goal of the present study was to investigate how NIR spectroscopy could be used to identify natural textile fibers that were approaching the end of their useful lives, such as cotton and silk, as well as synthetic fibers, such as viscose and a few of their blends.
The researchers designed, set up, and tested a methodological approach for textile fiber sorting and quality control in a recycling process. It was based on the use of two separate NIR-based devices, a portable single-spot spectroradiometer and an HSI system.
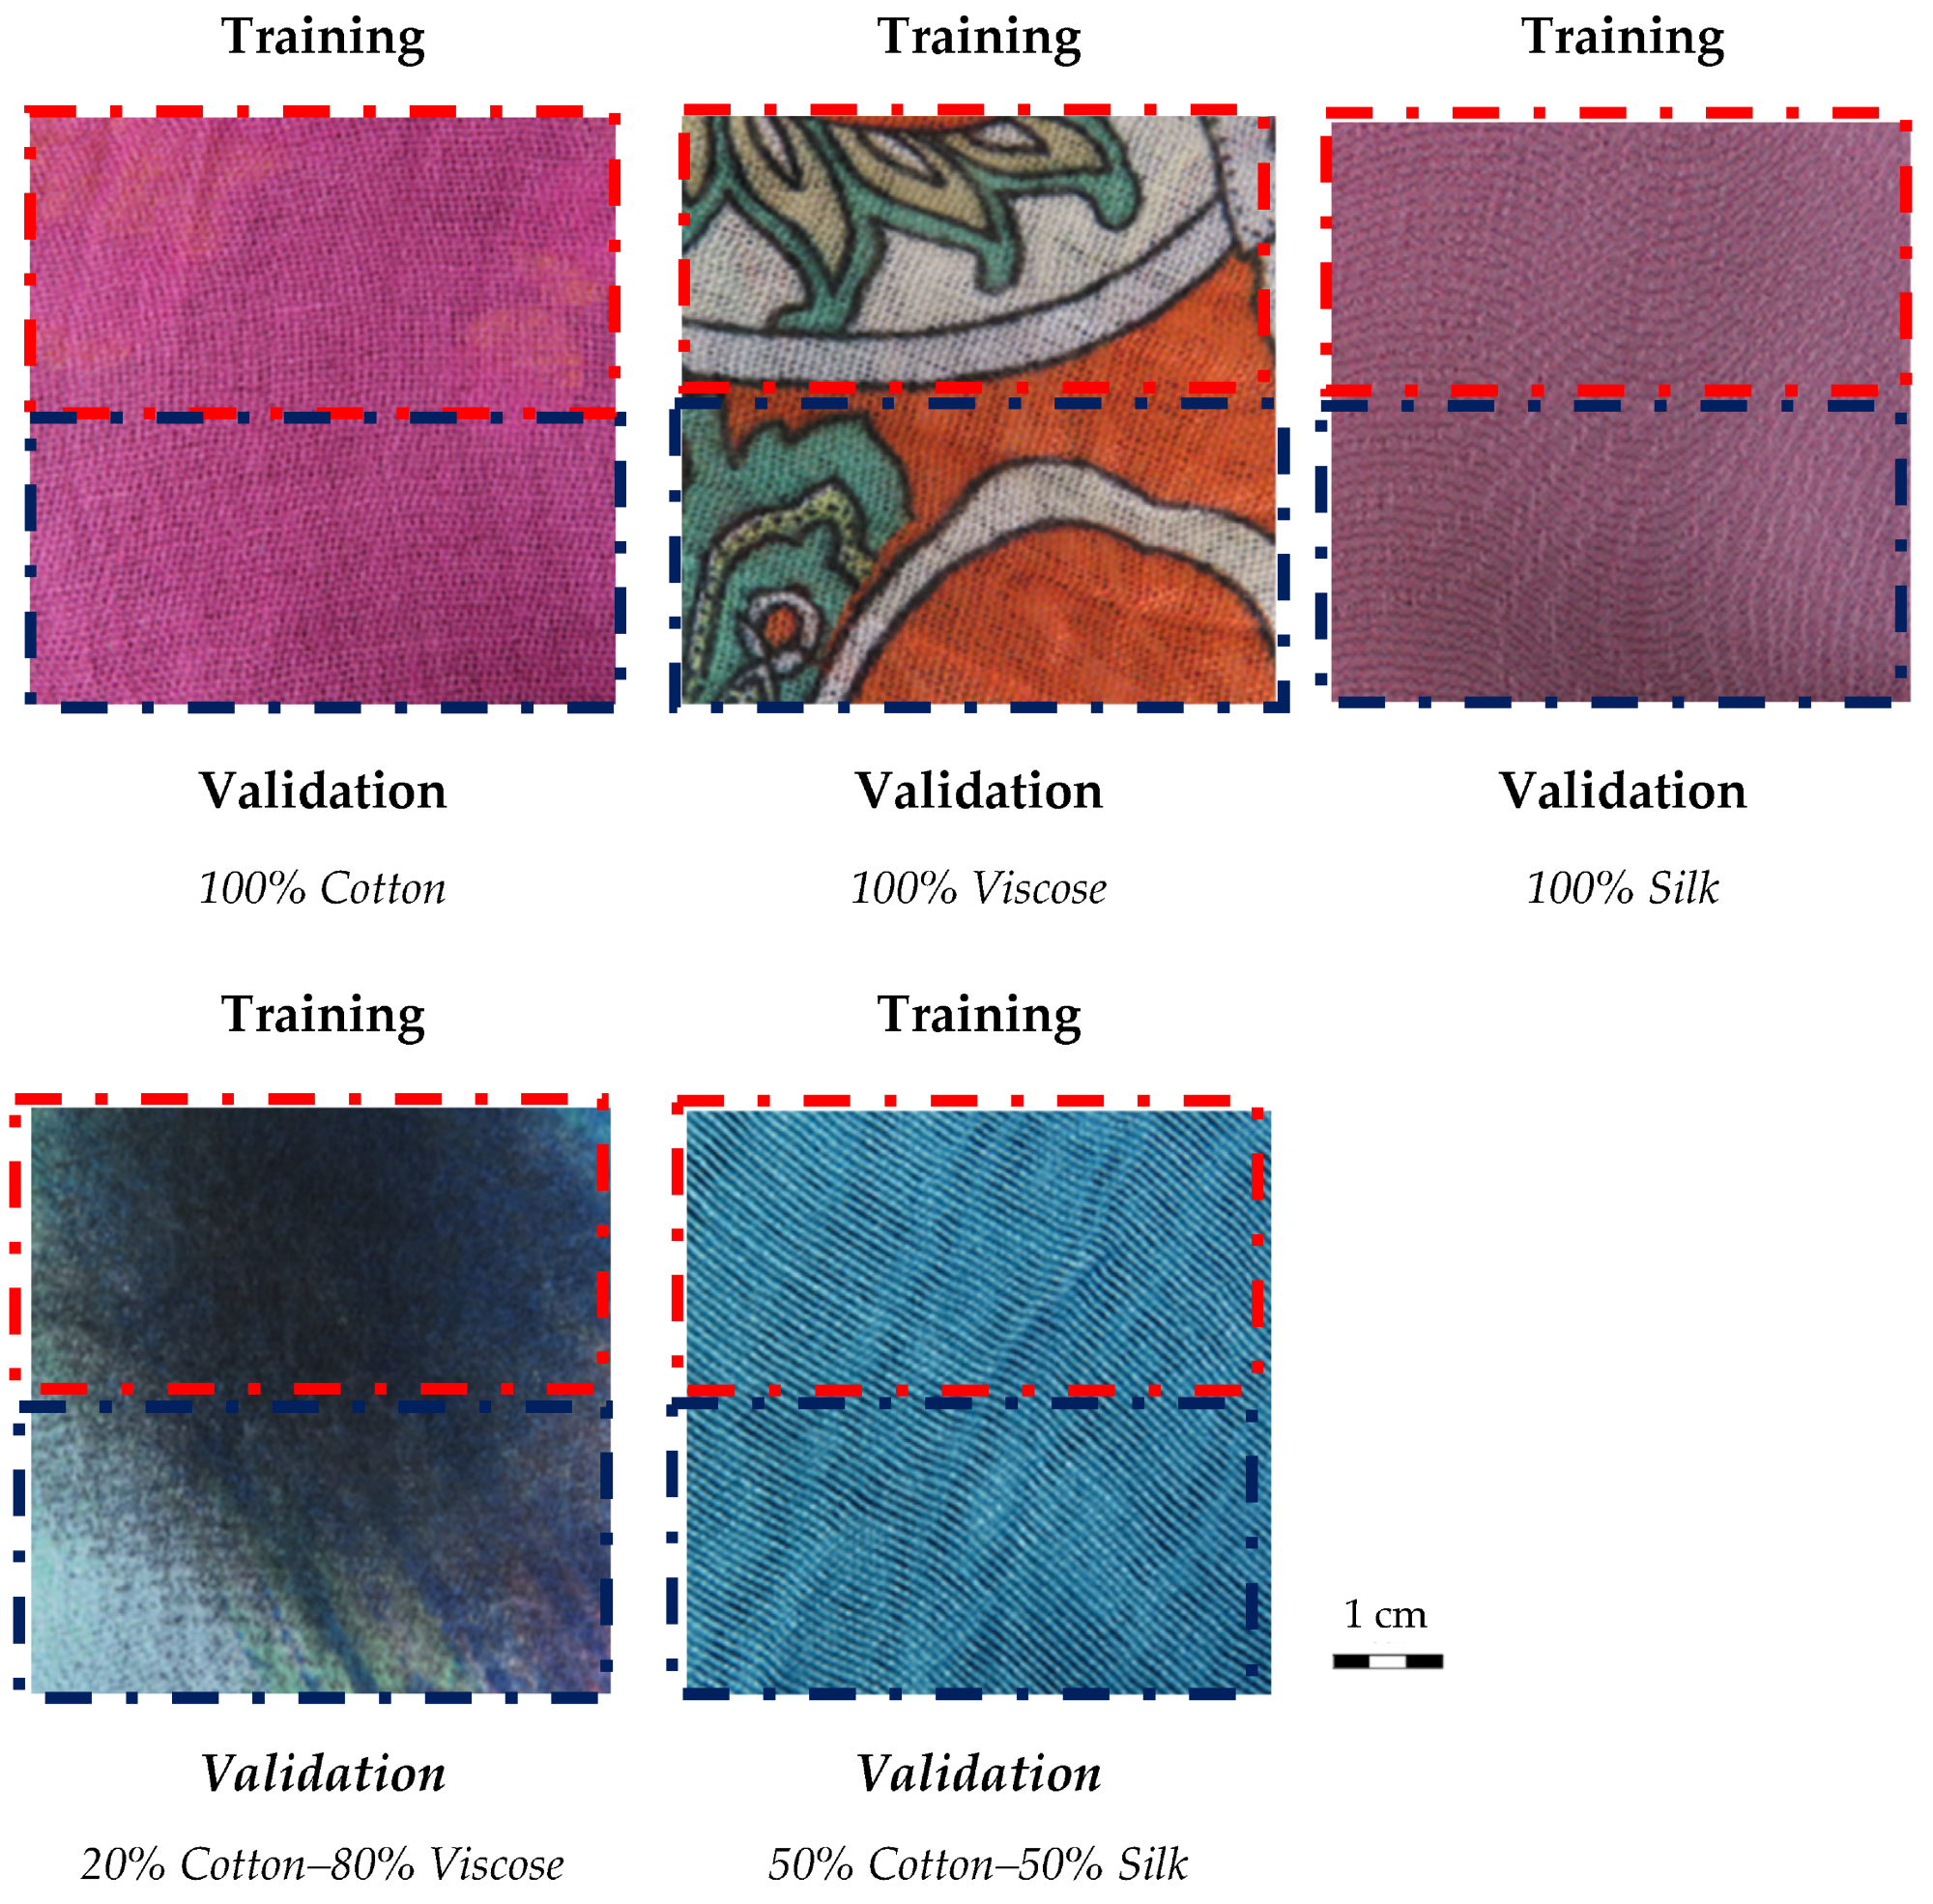
Regions of Interest (ROIs) used to create the training (red dotted area) and the validation (blue dotted area) images for each experimental set-up. Image Credit: Bonifazi, G et al., Sustainability
Observations
The examined silk and silk mix had distinctive bands of silk that were associated with the NH groups and ranged in wavelength from 1540 nm to 1580 nm. The cotton band was prevalent in the examined cotton-silk blend but less so in the cotton-viscose blend. It was located at about 1480 nm. This was attributed to the viscose, which made up a bigger percentage of the fabric and had a stronger influence. The cotton-viscose blend NIR spectra retained the viscose absorption bands between 1100 nm and 1200 nm and between 1350 nm and 1400 nm, connected to the CH groups.
In the first experimental setting, 87.74{05995459f63506108ab777298873a64e11d6b9d8e449f5580a59254103ec4a63} of the variance was explained by PC1, and 87.12{05995459f63506108ab777298873a64e11d6b9d8e449f5580a59254103ec4a63} of the variance was explained by PC1 in the second and third experimental setups. In addition, PC2 accounted for 1.24{05995459f63506108ab777298873a64e11d6b9d8e449f5580a59254103ec4a63}, 7.24{05995459f63506108ab777298873a64e11d6b9d8e449f5580a59254103ec4a63}, and 9.61{05995459f63506108ab777298873a64e11d6b9d8e449f5580a59254103ec4a63} of the variance in the first, second, and third experimental setups, respectively. The positive area of PC1 partially overlapped 100{05995459f63506108ab777298873a64e11d6b9d8e449f5580a59254103ec4a63} viscose and 20{05995459f63506108ab777298873a64e11d6b9d8e449f5580a59254103ec4a63} cotton-80{05995459f63506108ab777298873a64e11d6b9d8e449f5580a59254103ec4a63} viscose, whereas PC1 distinguished “100{05995459f63506108ab777298873a64e11d6b9d8e449f5580a59254103ec4a63} Cotton” from the other two textile types. In PC1, 100{05995459f63506108ab777298873a64e11d6b9d8e449f5580a59254103ec4a63} silk was distinguished from the other two categories; however, 100{05995459f63506108ab777298873a64e11d6b9d8e449f5580a59254103ec4a63} cotton and 50{05995459f63506108ab777298873a64e11d6b9d8e449f5580a59254103ec4a63} cotton-50{05995459f63506108ab777298873a64e11d6b9d8e449f5580a59254103ec4a63} silk were clearly distinguished in PC2. The values for specificity, sensitivity, and precision (P) varied from 0.997 to 1.000, 0.975 to 1.000, and 0.992 to 1.000, respectively.
The outcomes demonstrated that the used methods enabled the correct classification of various textile types, with a precision rate for HSI pictures above 99.2{05995459f63506108ab777298873a64e11d6b9d8e449f5580a59254103ec4a63} and for single-spot data hovering around 100{05995459f63506108ab777298873a64e11d6b9d8e449f5580a59254103ec4a63}.
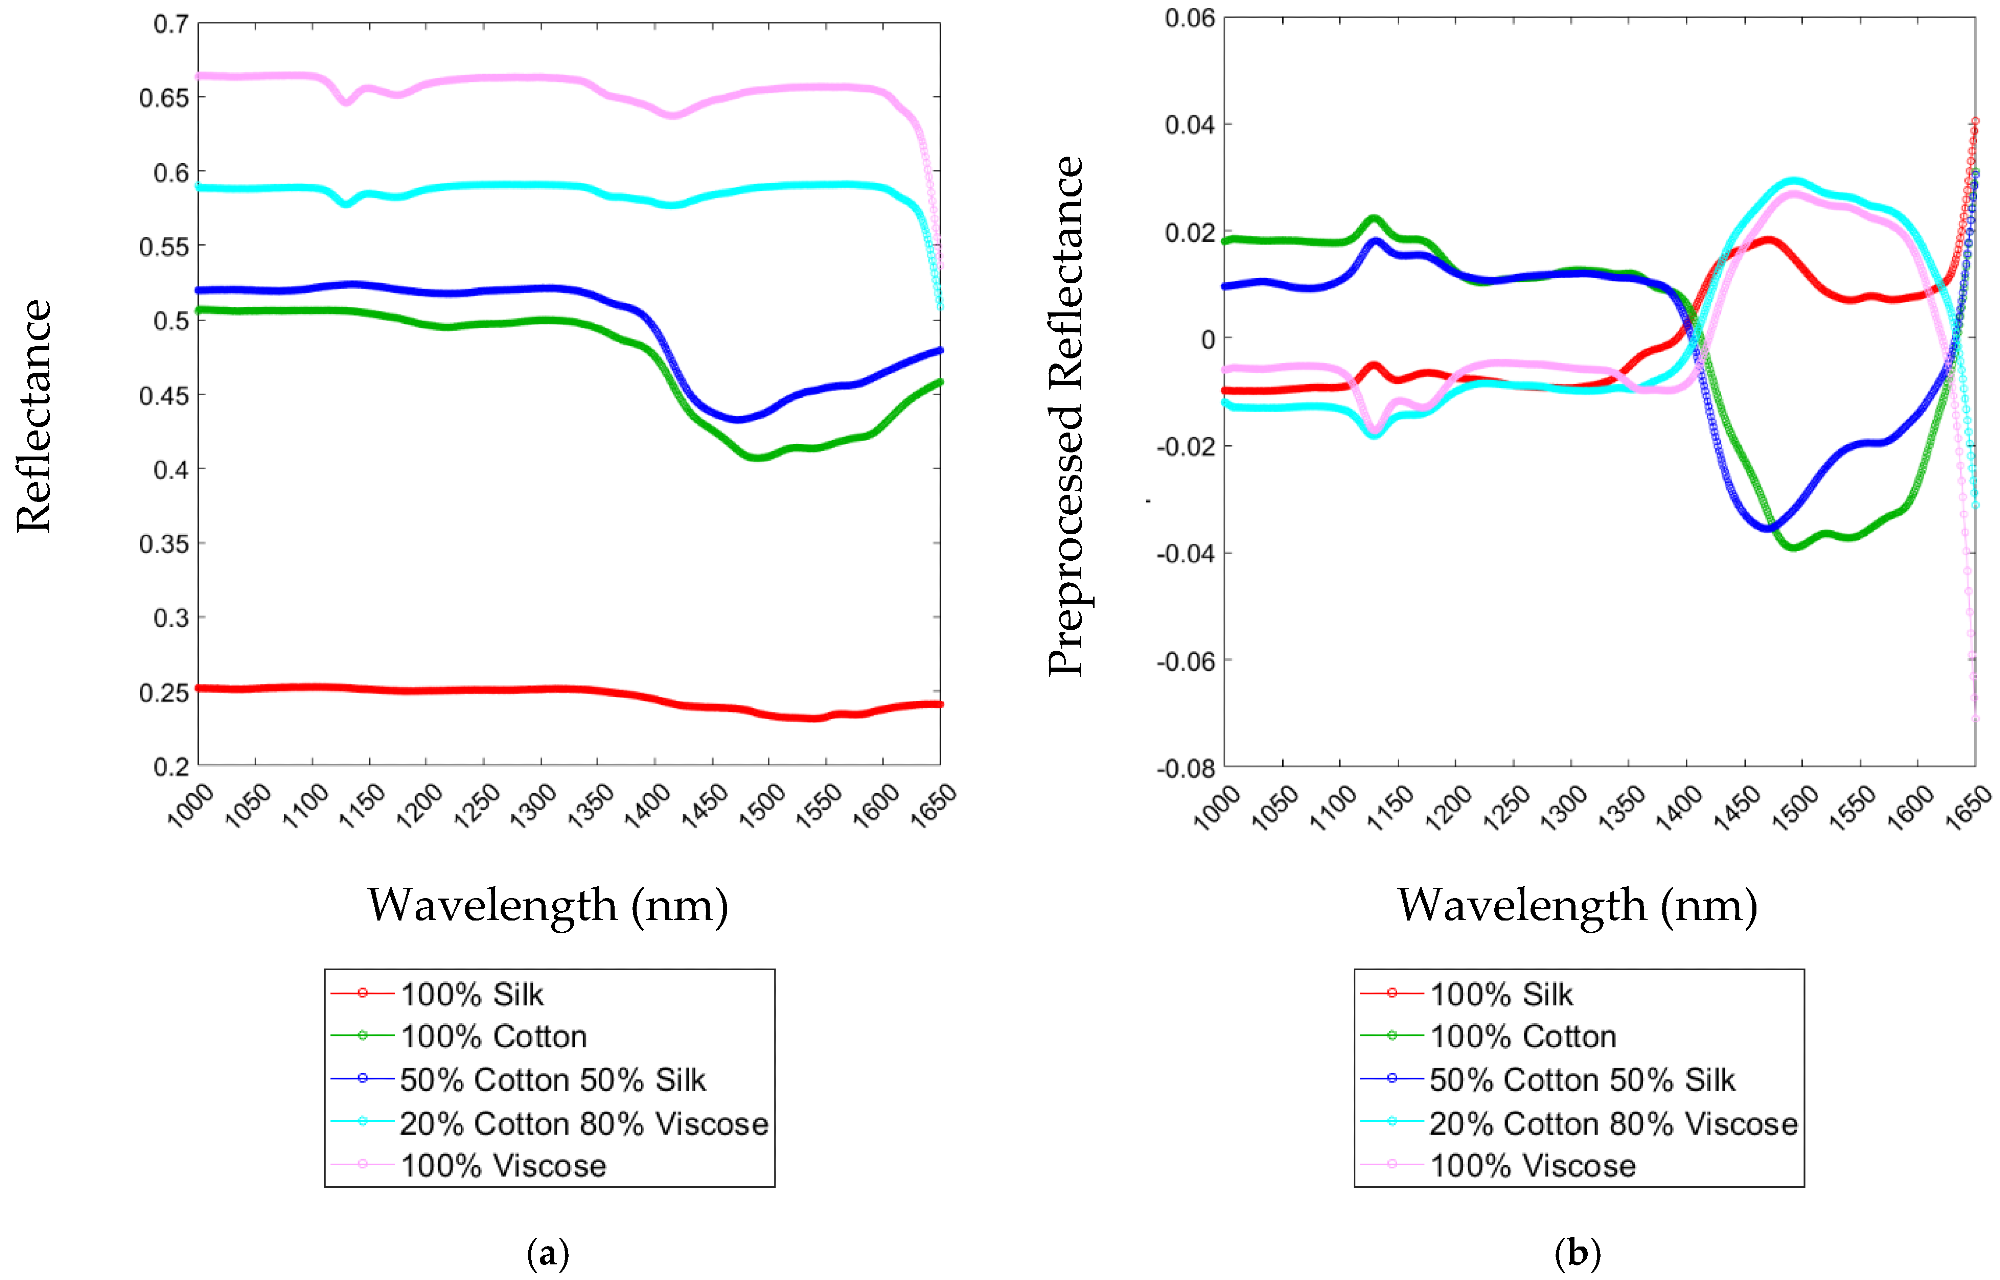
Raw (a) and preprocessed spectra (b) after applying Detrend, Smoothing, and Mean Center algorithms of “100{05995459f63506108ab777298873a64e11d6b9d8e449f5580a59254103ec4a63} Cotton”, “50{05995459f63506108ab777298873a64e11d6b9d8e449f5580a59254103ec4a63} Cotton–50{05995459f63506108ab777298873a64e11d6b9d8e449f5580a59254103ec4a63} Silk”, “20{05995459f63506108ab777298873a64e11d6b9d8e449f5580a59254103ec4a63} Cotton–80{05995459f63506108ab777298873a64e11d6b9d8e449f5580a59254103ec4a63} Viscose”, “100{05995459f63506108ab777298873a64e11d6b9d8e449f5580a59254103ec4a63} Viscose”, and “100{05995459f63506108ab777298873a64e11d6b9d8e449f5580a59254103ec4a63} Silk” samples. Image Credit: Bonifazi, G et al., Sustainability
Conclusions
In conclusion, this study discussed if it was possible to use NIR spectroscopy in end-of-life textile recycling in line with circular economy concepts. A portable spectro-photoradiometer and an HSI system were both used to accomplish this task. The portable tool could be used to quickly analyze textile waste that was supplied to the recycling facility and recover final products and samples gathered at various operation stages for process control. The HSI system could also be used as a sensor-based sorting system in addition to serving the same functions.
The authors mentioned that the suggested strategy could be viewed as a methodological process to be used consistently at the level of a recycling plant. They stated that additional classification models will be created and applied to a wider range of textile waste samples, including both pure fabrics and mixes, in order to categorize as many fabrics as possible as well as to calculate the percentage of each fabric type in each sample.
References
Bonifazi, G., Gasbarrone, R., Palmieri, R., et al. End-of-Life Textile Recognition in a Circular Economy Perspective: A Methodological Approach Based on Near Infrared Spectroscopy. Sustainability 14(16) 10249 (2022). https://www.mdpi.com/2071-1050/14/16/10249
